
Sometimes, when we are building dashboards, we struggle to choose the right colors for our visualizations. We try to pick the right combination by using the strongest colors the company’s logo we are working with has. This is what we think is the way to do it, isn’t? After all, we are not design experts.
Big companies usually have this sorted out. They have a graphic design team, a branding team, and who knows what other teams that work on the marketing of the company, and make sure that all communications or documents produced by the company follows the visual identity guidelines that were created.
These teams go as far as creating the color palette that must be used in your PowerPoint presentations, email signature, among other things. They even specify the RGB color codes you must use for the company’s website, or, as our post topic might suggest, for the company’s dashboards/reports. Yes, some reporting/dashboarding tools, such as Tableau, allow you to set up a custom color pallete that matches your companty visual identity. Below you can see the steps on how you can achieve this:
1. Go to your Tableau user’s folder: C:\Users\YourUser\Documents\My Tableau Repository
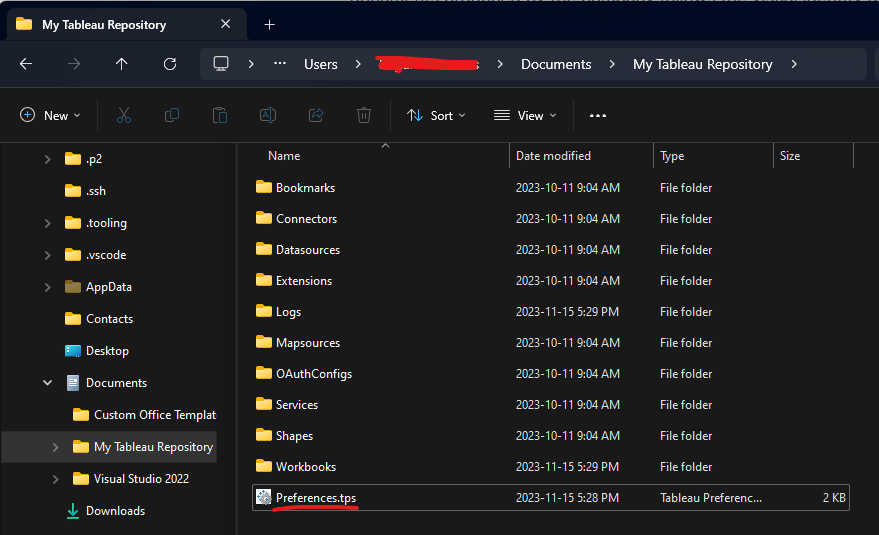
2. Find the xml file named: preferences.tps
3. Open the file, add a new section called preferences
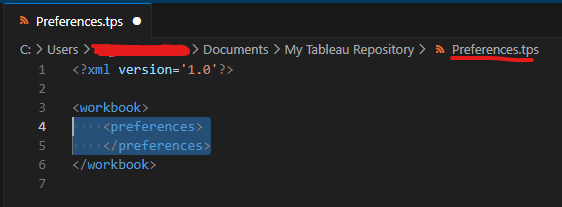
4. Add your custom color pallete

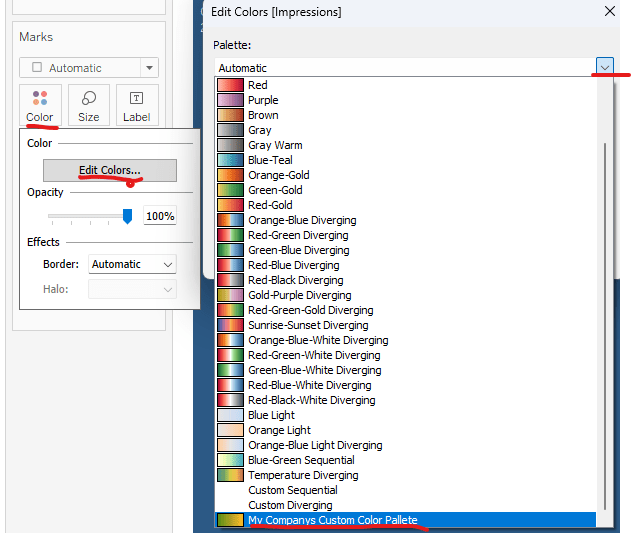
5. Save the file, open an existing workbook, and go to any data vizulation you have. You should see the new custom color palette.

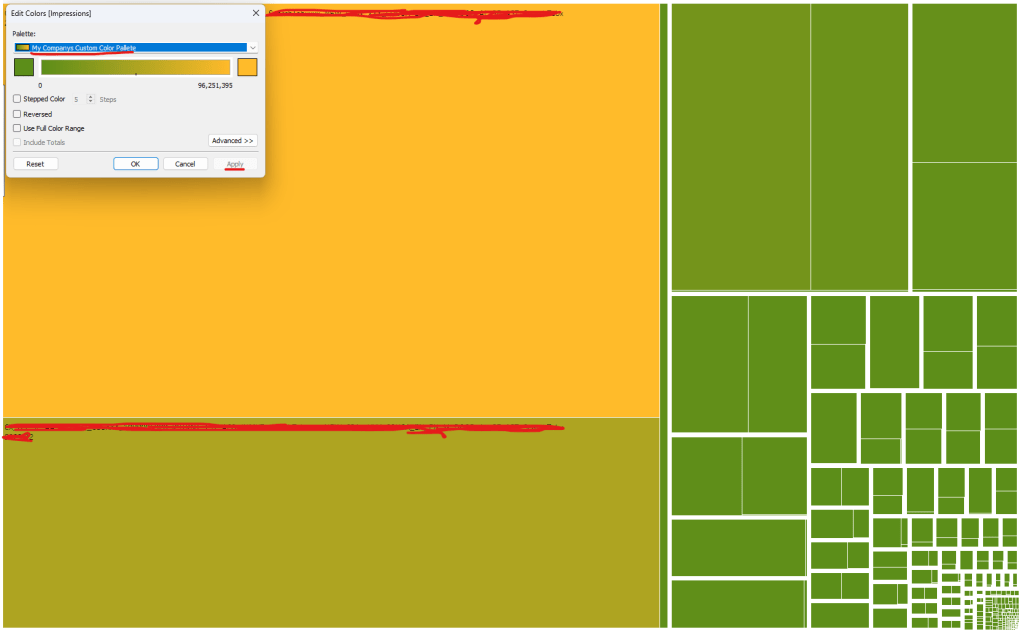
6. Click on the Apply button, and the colors of your visualization should change after that.
Summary
In this post, we learned how Tableau allows us to use our own custom color palette. Whether it is to follow a company’s visual identity guideline, or to implement a dashboard with the color patterns we like the most, it is certainly a nice feature to have in a reporting tool.
I hope this short post has been helpful!

Leave a comment